R
Raghavan Sridharan Posted on 22/04/2020
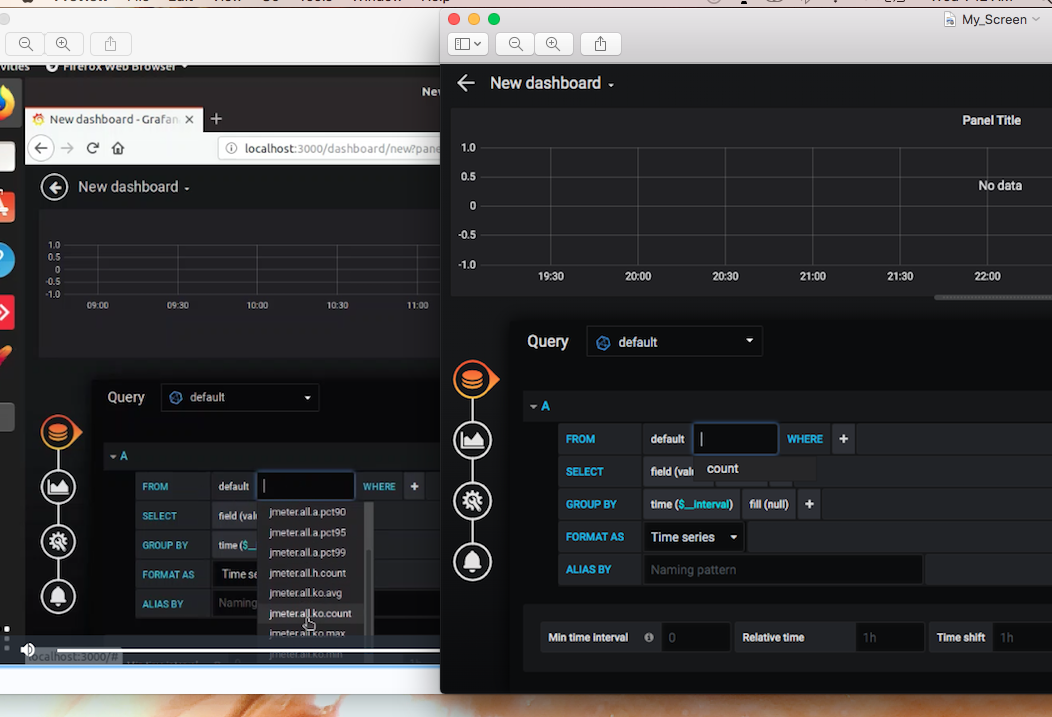
I tried following the same steps as mentioned in the video but in the Grafana dashboard I'm not able to select the options from measurement in query page. I have added both the screenshot. ONe from the training and the other from my screen. Kindly take a look into it and guide me what changes needs to be done to see the list of drop down that you are seeing. Thanks.

A
Instructor
Abhishek Puri Replied on 23/04/2020
Please make sure that your data is going to the influxdb properly.
If still it is not working then let us know.
JMeter Tutorials
Chrome Developer Tools | Beginners Tutorial 15 Min
JMeter Variables 6 Min
Understanding Thread Group | JMeter Tutorial 11 Min
JMeter Sampler | JMeter HTTP Request 10 min
What is Performance Testing? 5 Min
JMeter Test Script Recorder | How to record Script 8:04 min
HAR to JMX 4 Min
JMeter Functions 6 Min
JMeter Test Plan | How to generate a user load 7 Min
Plugins in JMeter 12 min
Performance Testing Fundamentals with JMeter 9 Min
HTTPS Script Recording 7:55 Min


